Project Overview
Company
Late series climate tech & sustainability startup
Role
Design Lead
Team
~30 individuals over three teams:
3 Tech Leads
3 Product Managers
2 Designers
1 UX Research
~20 Engineers
Results
Created and drove adoption of the organization’s leading bet for 2023/2024
Led three teams of PMs, UX, and Engineering to execute on the strategy
Achieved a case for 3.6x growth, increasing revenue from seven to eight figures over 9 months; validated with a six-figure scalable pre-revenue in a 3-month MVP
The Challenge

Business Objective
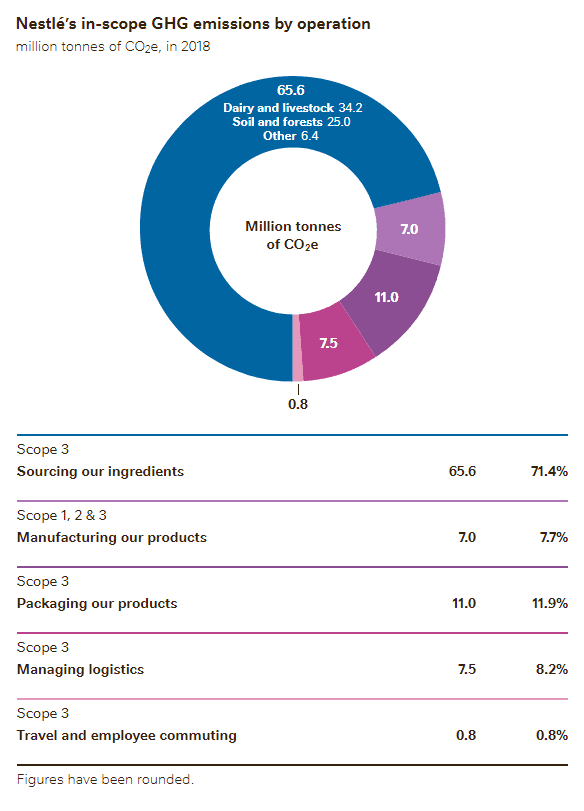
In Indigo’s efforts to help large food companies reach carbon-zero, we had run into barriers to scale — only the largest players could afford our solutions.
I was selected for the project to discover:
Was there demand for lower impact, but lower cost solutions?
Are there other paths to scale?
If so, what might those paths/solutions look like?
Discovery & Definition
Discovery
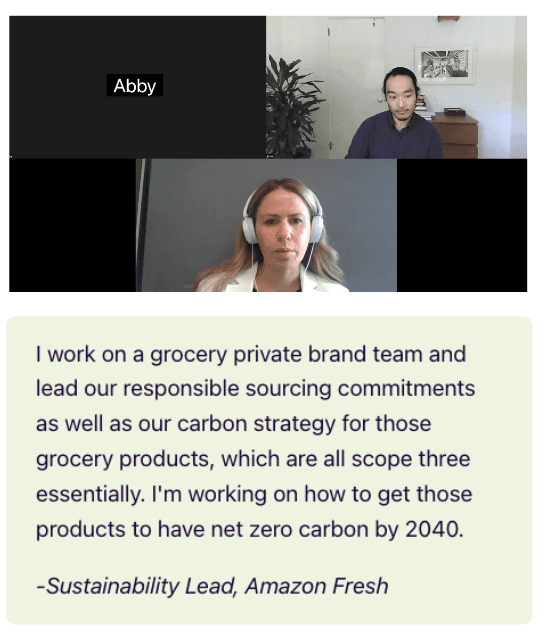
I validated these questions by gathering feedback from a range of actors in the supply chain as well as internal subject matter experts (SMEs). As a player-coach, I drove the project forward by recruiting, scriptwriting, facilitating, and synthesizing research, as well as providing support for my initial team (a UX researcher & Product Manager) and aligning efforts to stakeholder expectations.
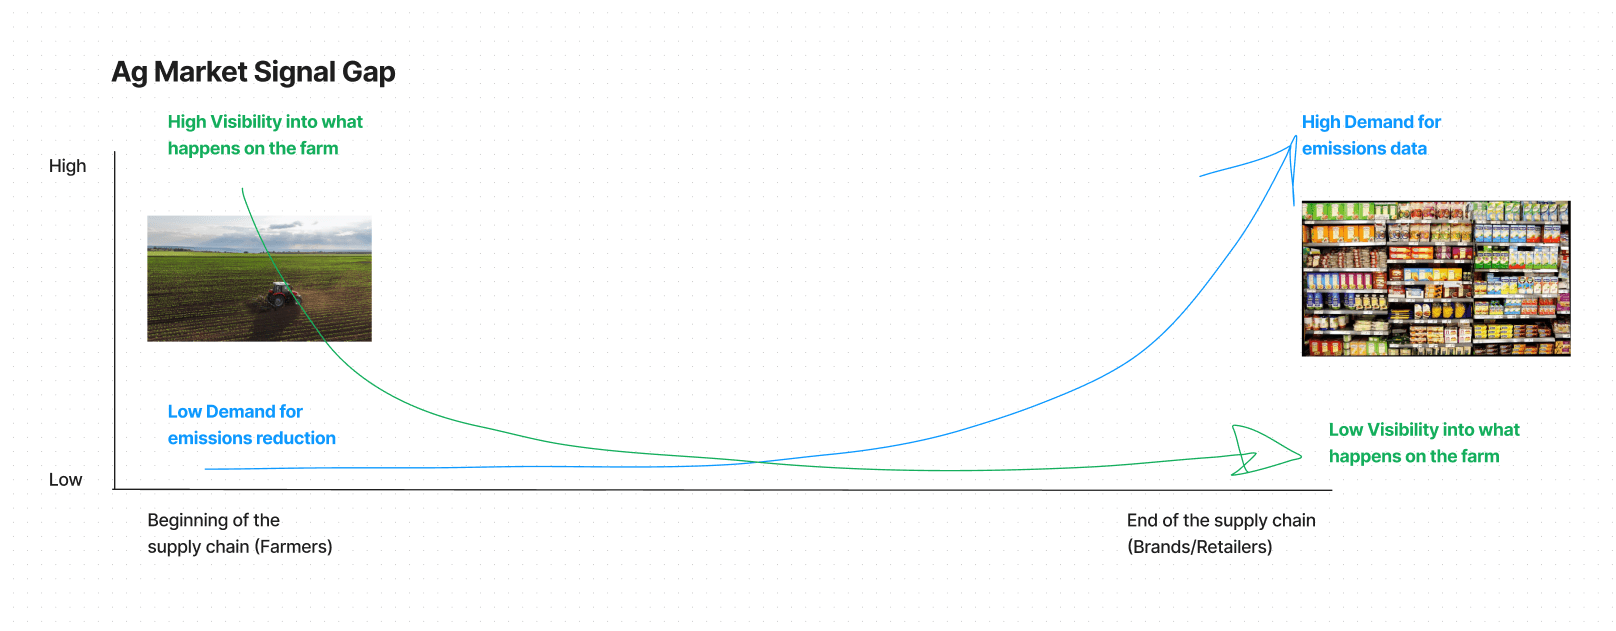
As a result, I was able to provide a perspective that concluded that the industry did indeed have a problem figuring out how to measure the environmental impact of supply chains.
This perspective and subsequent strategic vision became the leading bet for the organization in 2023 and 2024.
Problem Definition
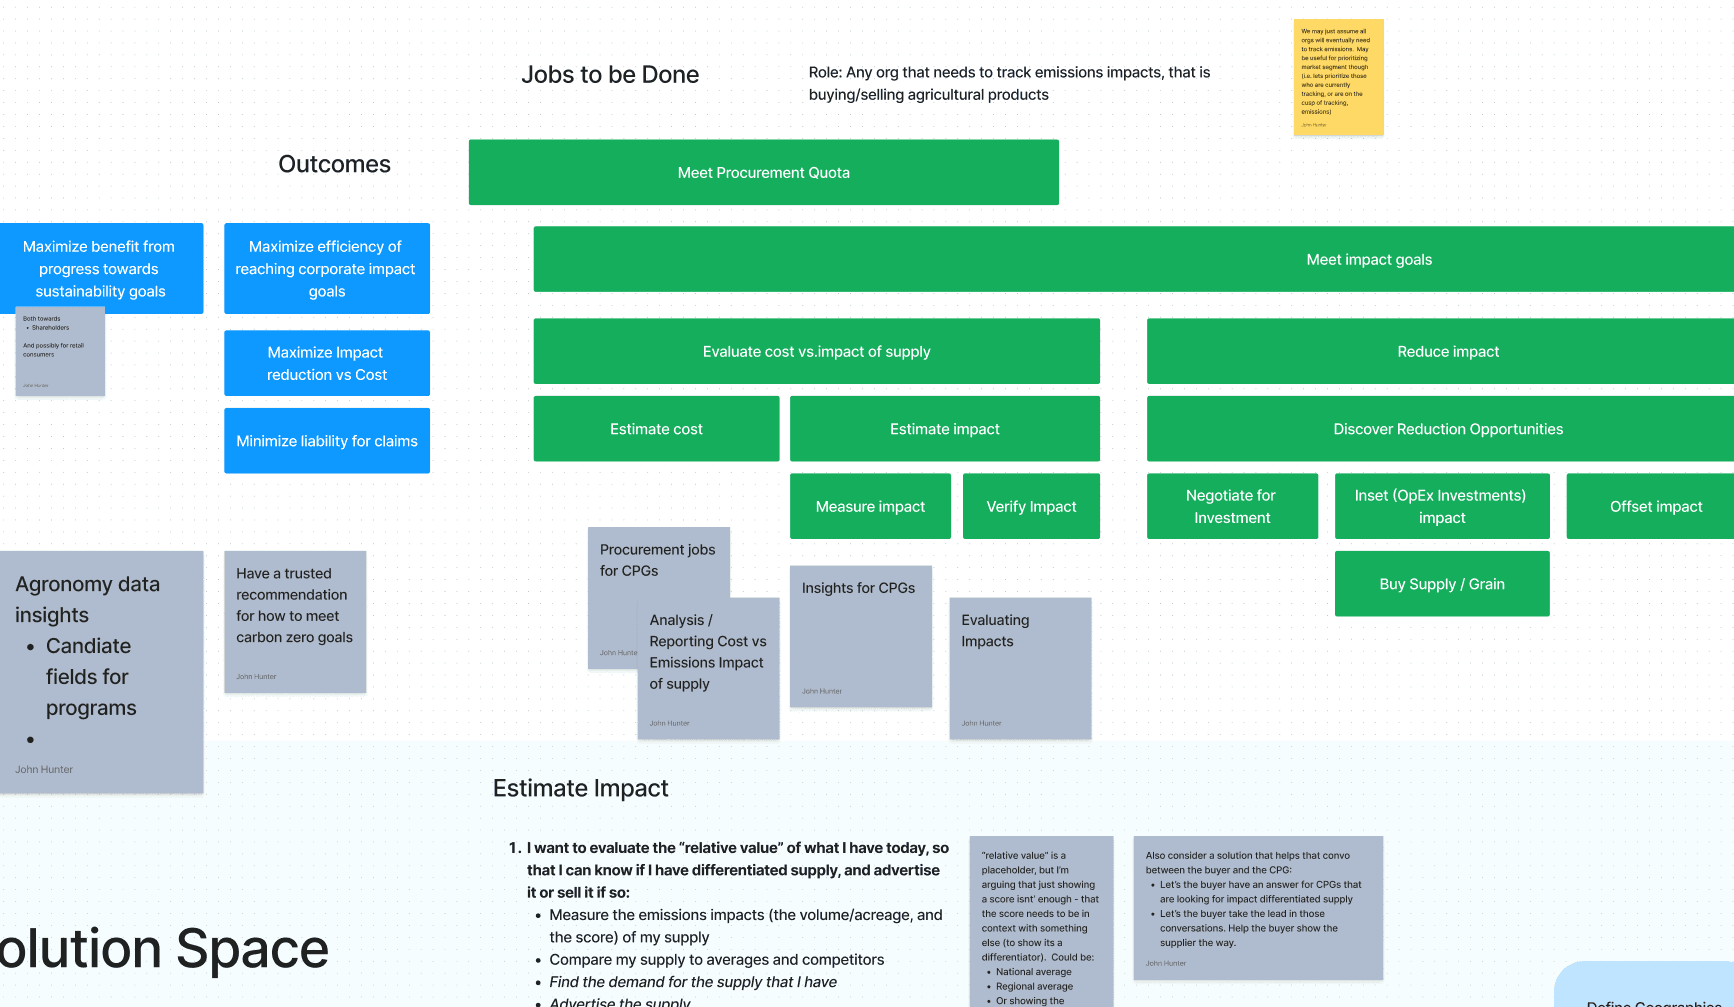
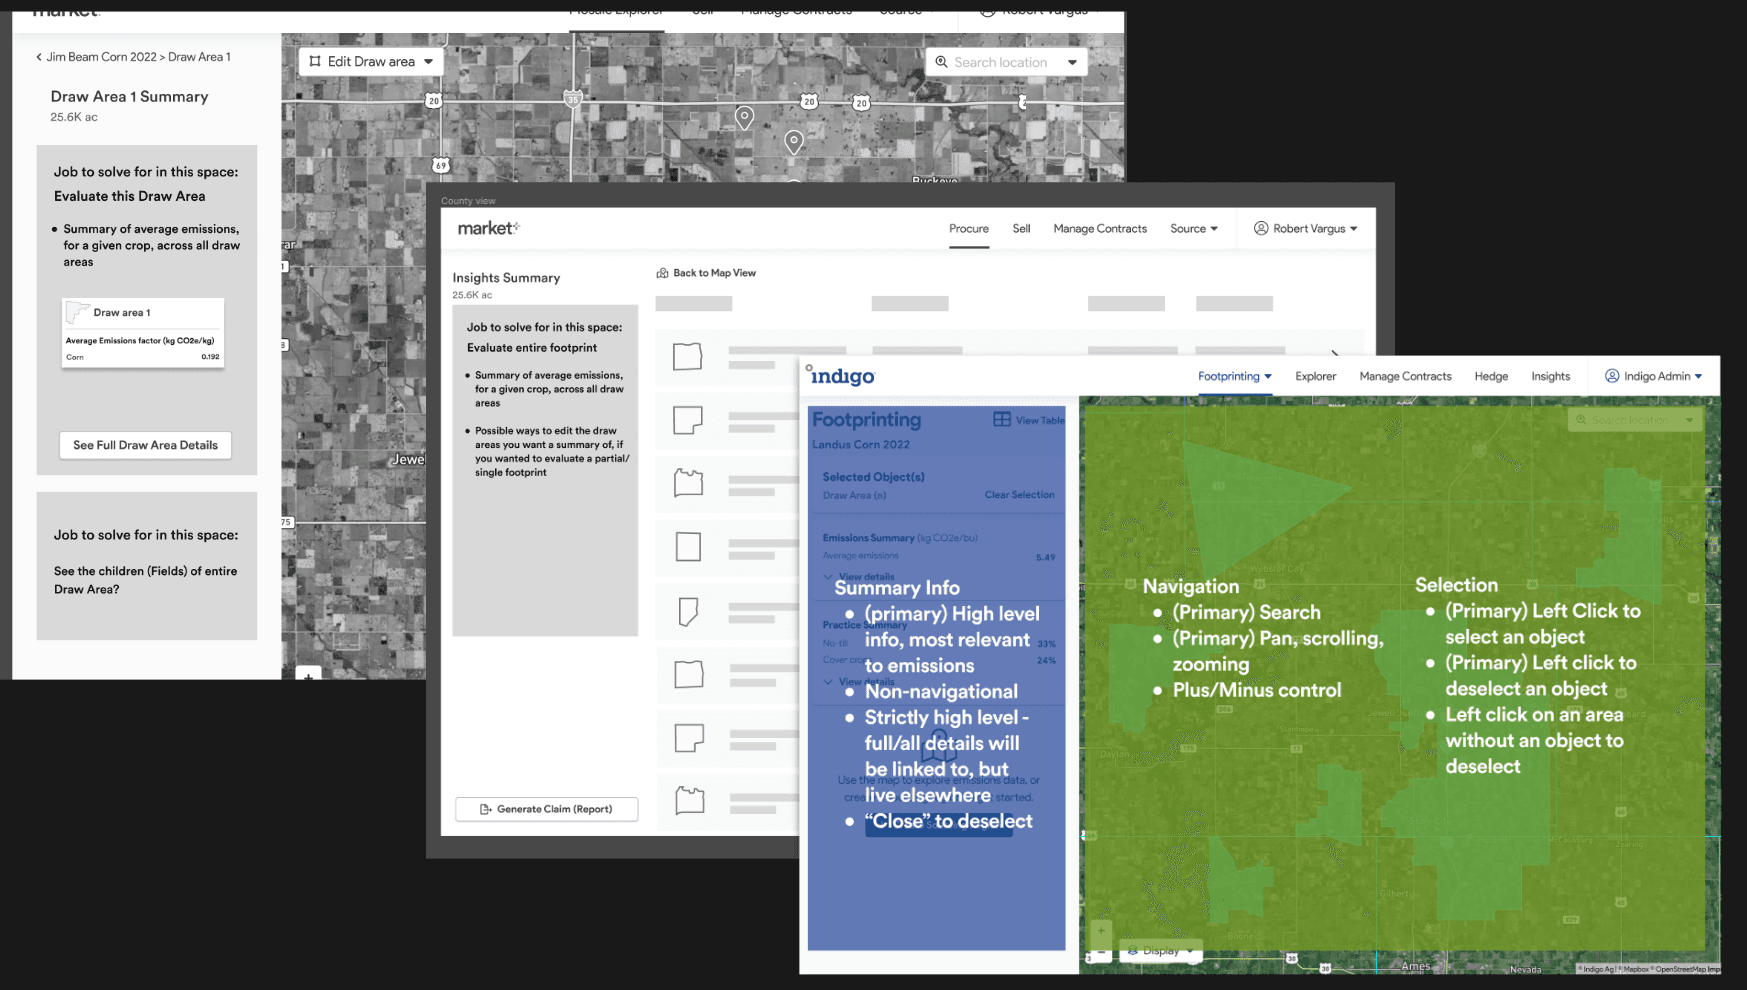
I took research insights and created a framework of Jobs-to-be-done (Jobs) to gather a comprehensive understanding of what users are trying to accomplish. Additionally it provided a user-centric foundation to have concrete simplifying trade-off discussions with Product Managers and stakeholders.
I arrived at this thesis:
If an organization can measure the emissions of their supply chain, then they will look for opportunities for reduction.
We will know this to be true when (KPIs):
Increased conversion rate for top-end sales funnel of Indigo’s grain programs
Concepting
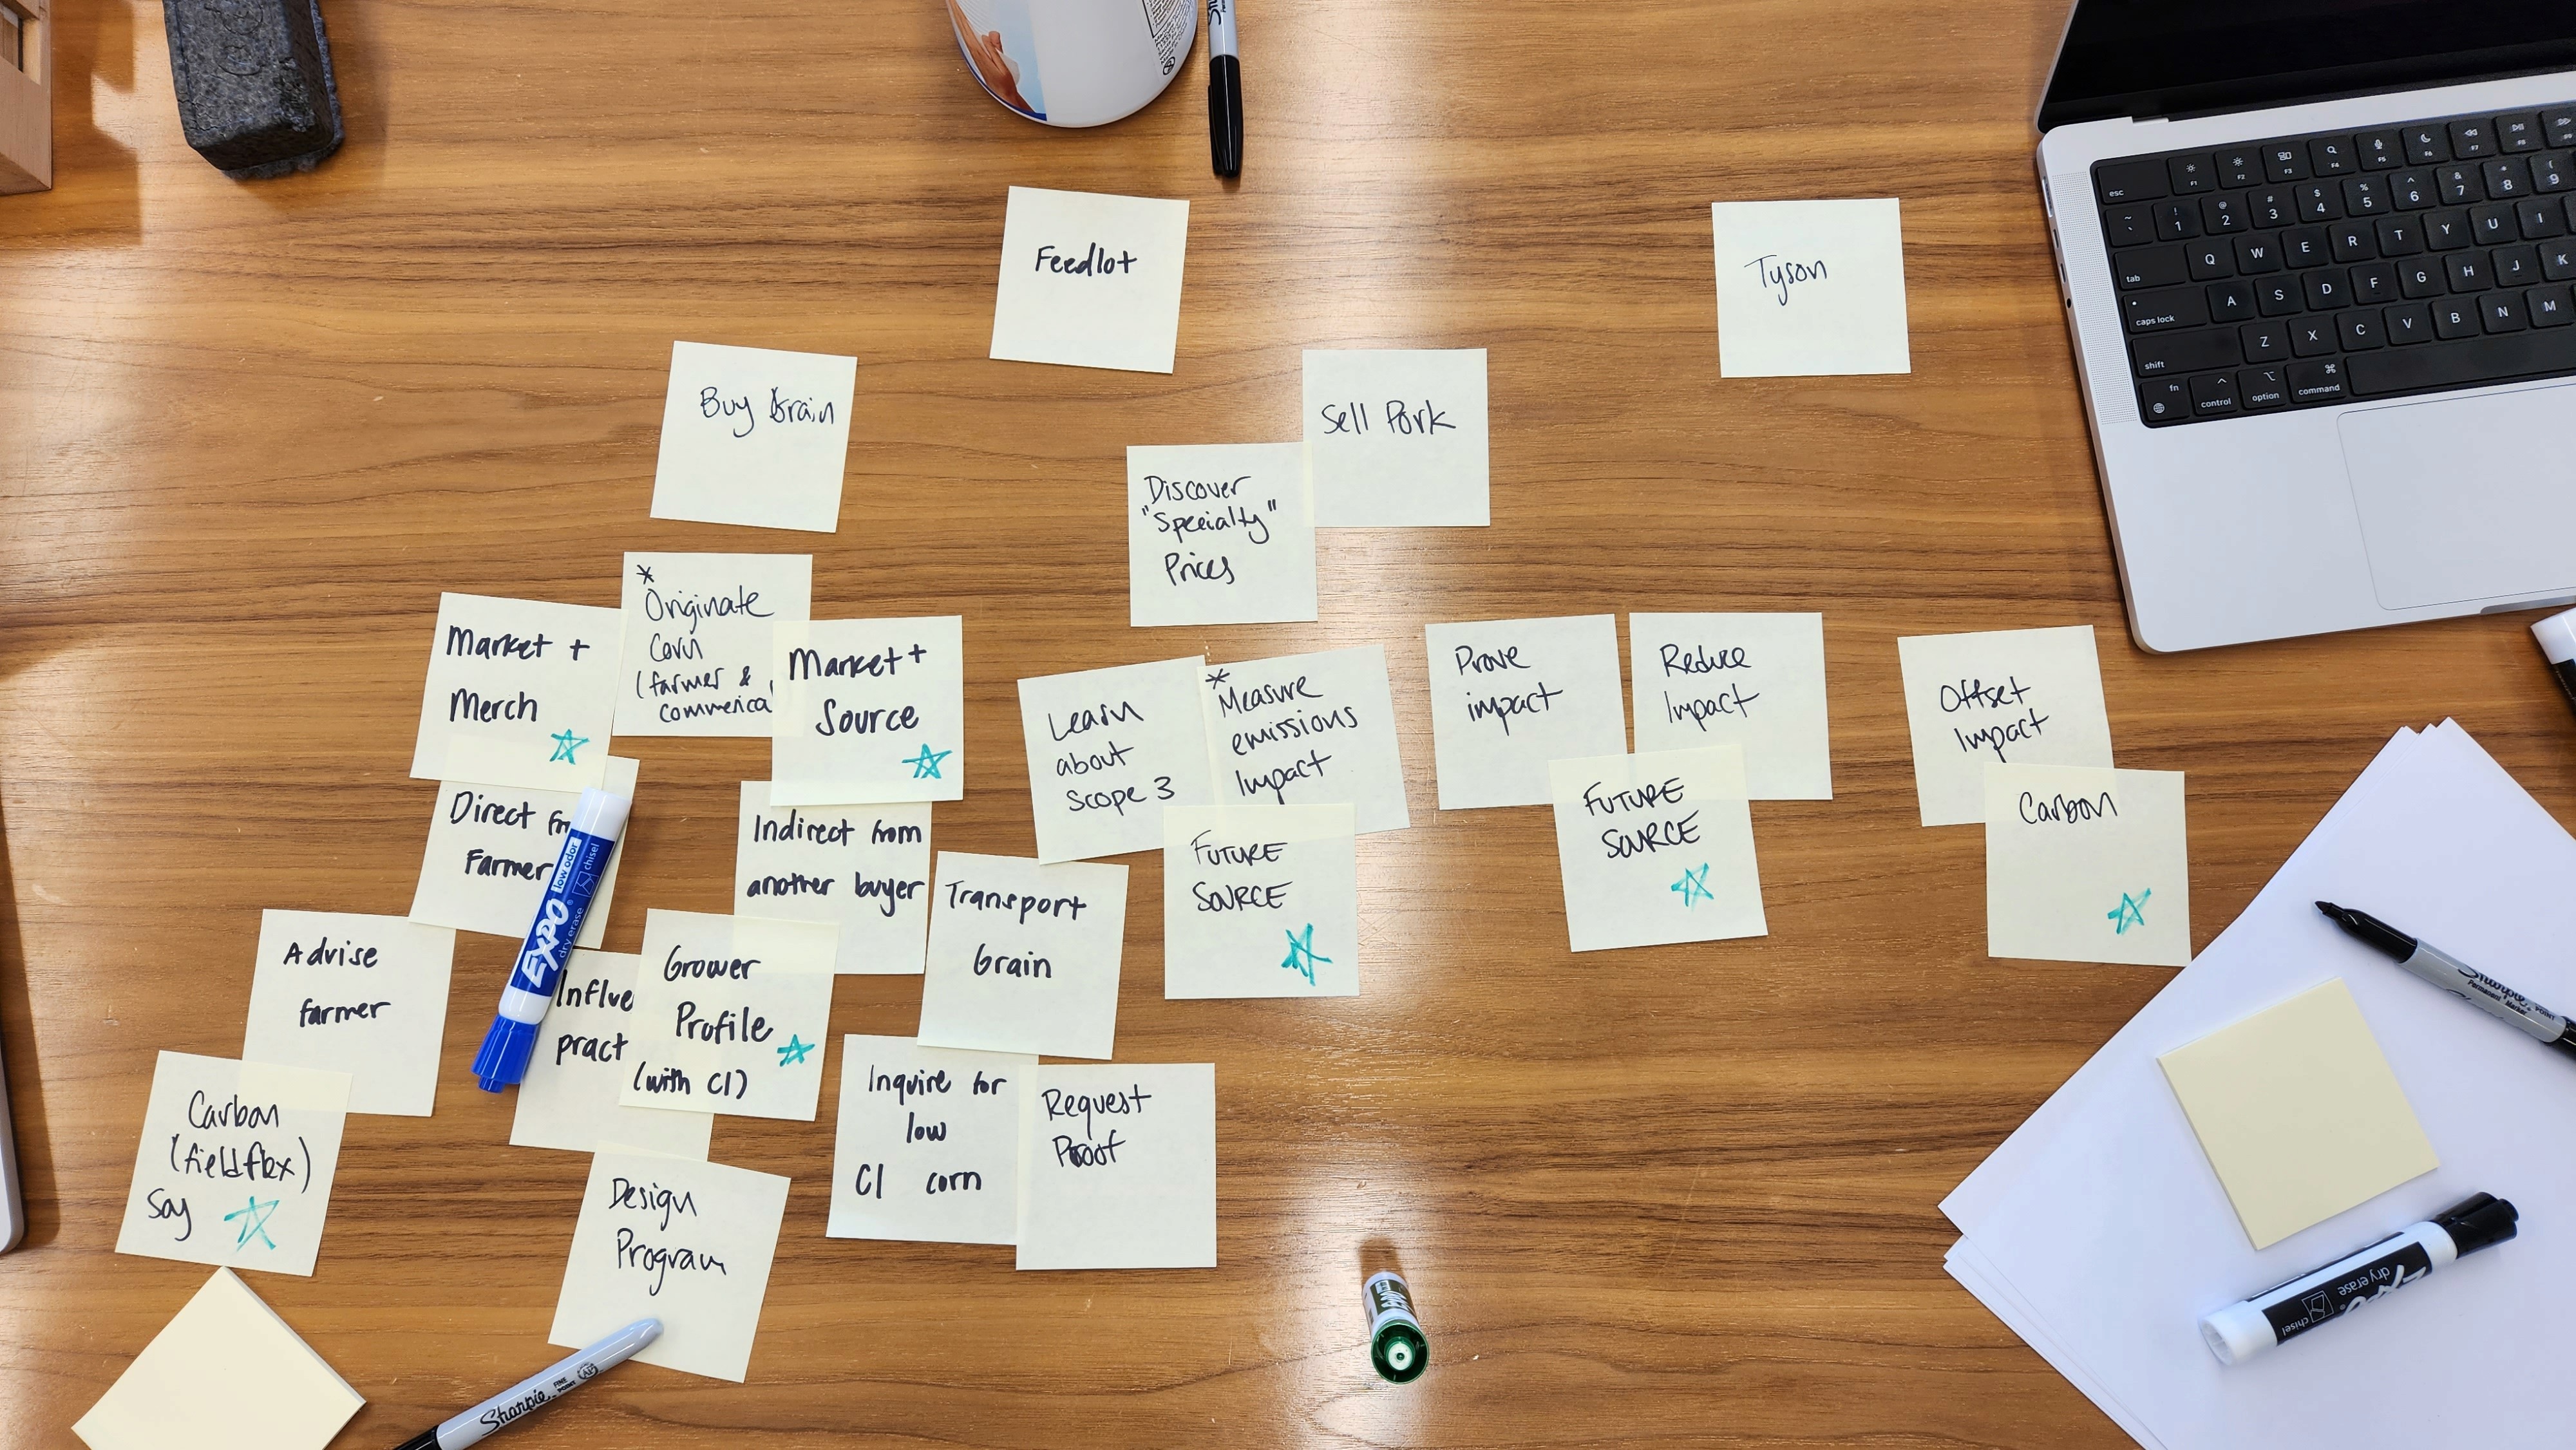
I took the thesis & the user needs (Jobs) and ran a workshop with stakeholders & team members to introduce the problem space, and generate possible solutions. This was a quick way to achieve two things:
Collaborate to get a high quantity of solutions/ideas,
Build engagement & excitement with stakeholders.
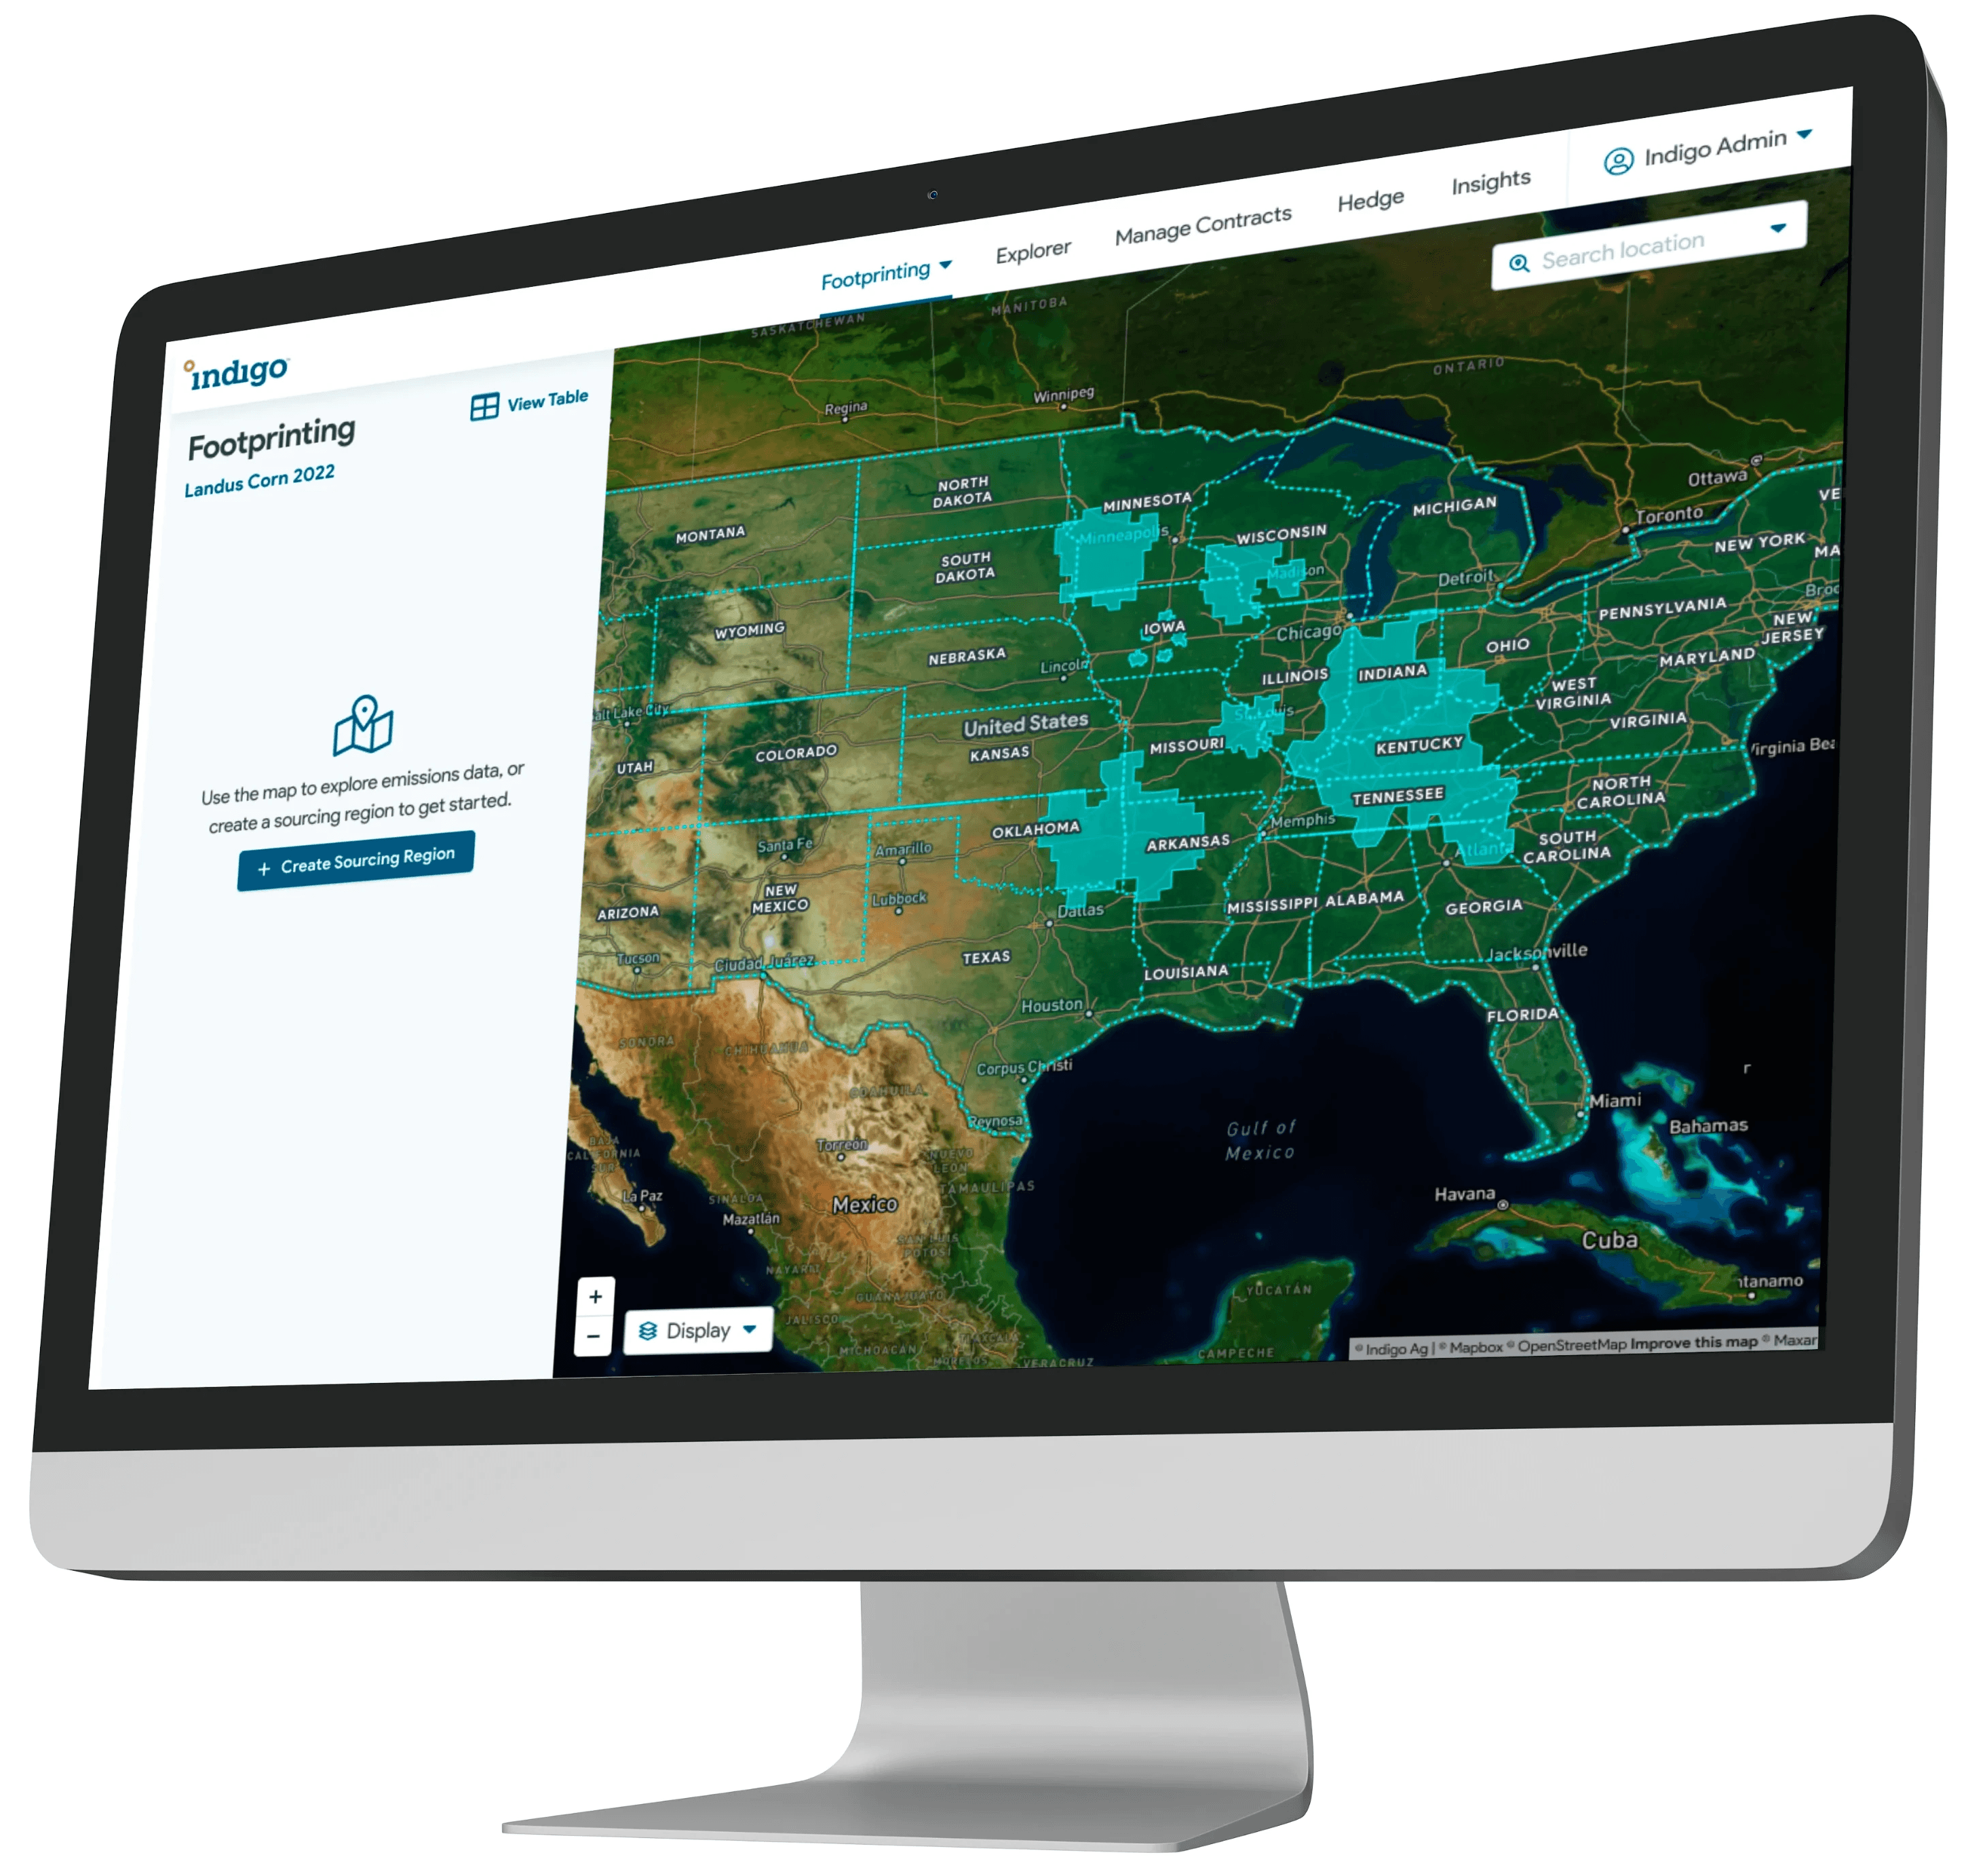
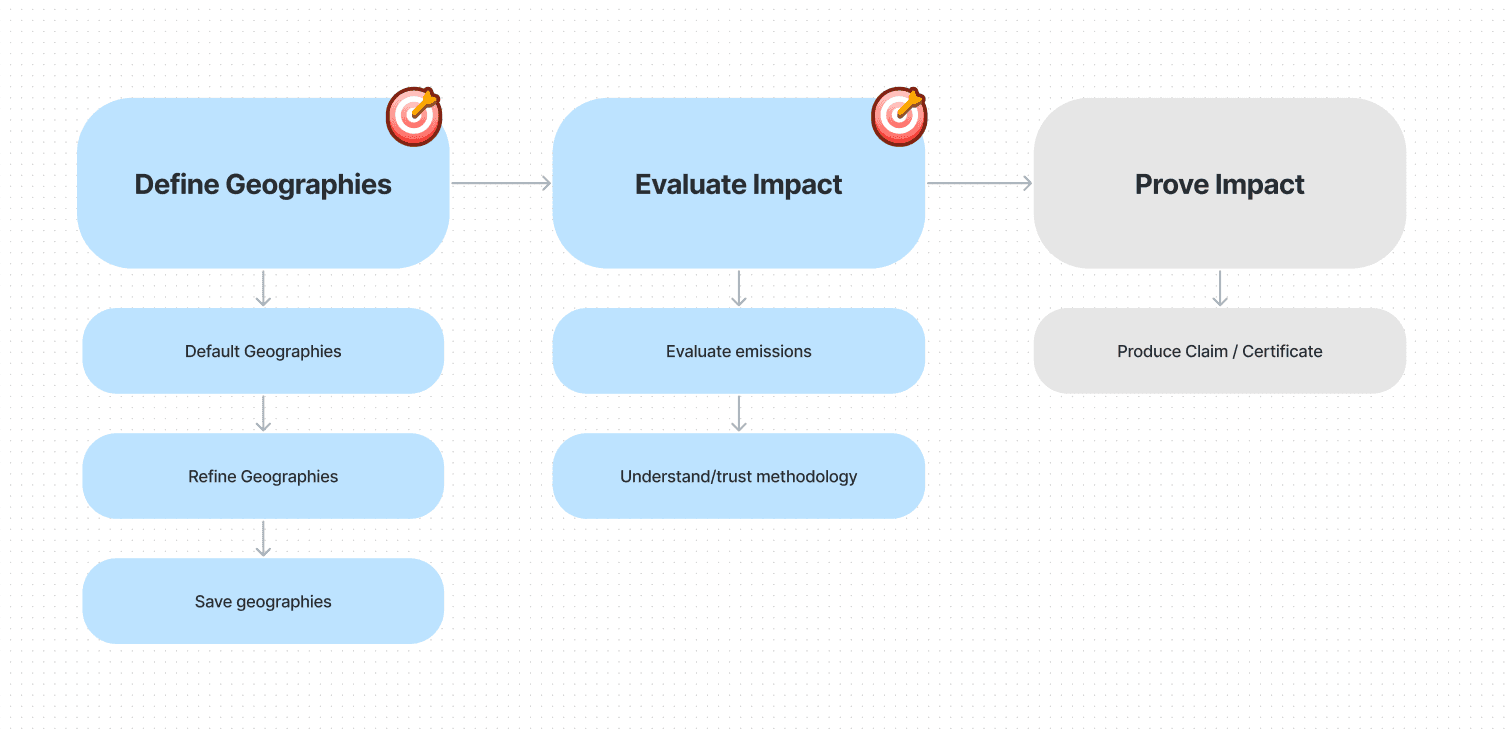
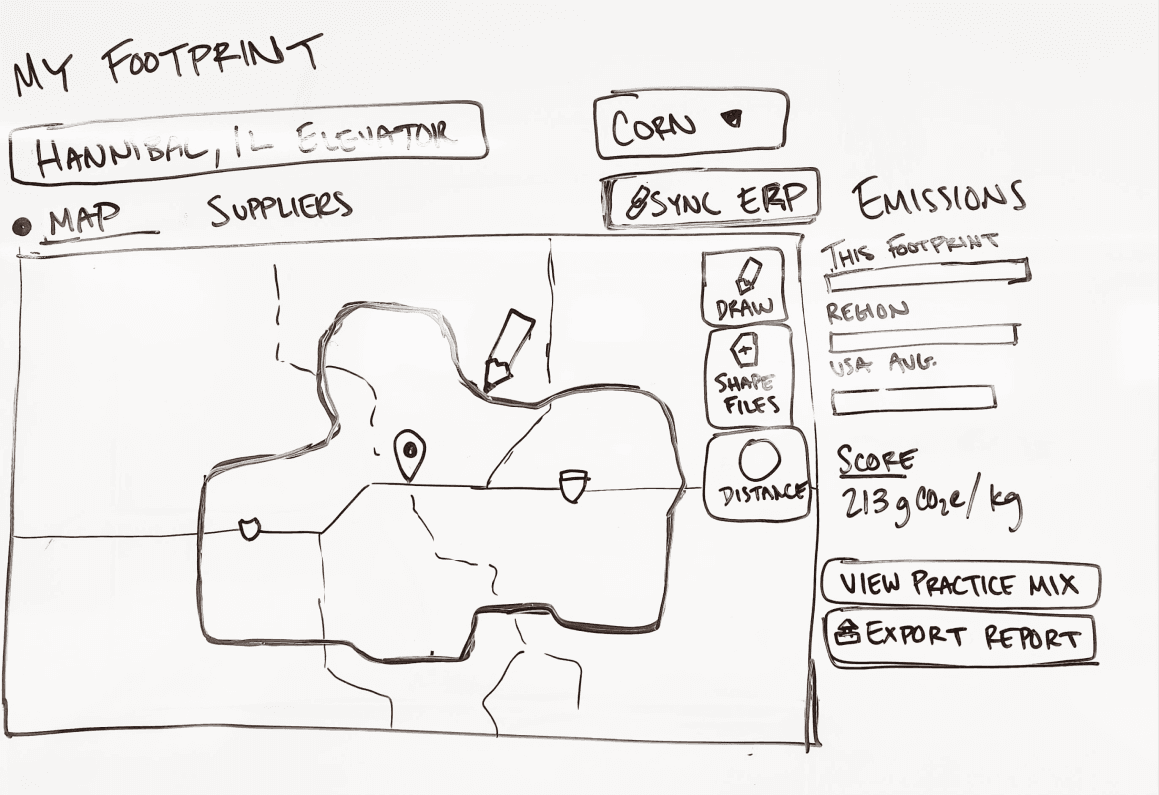
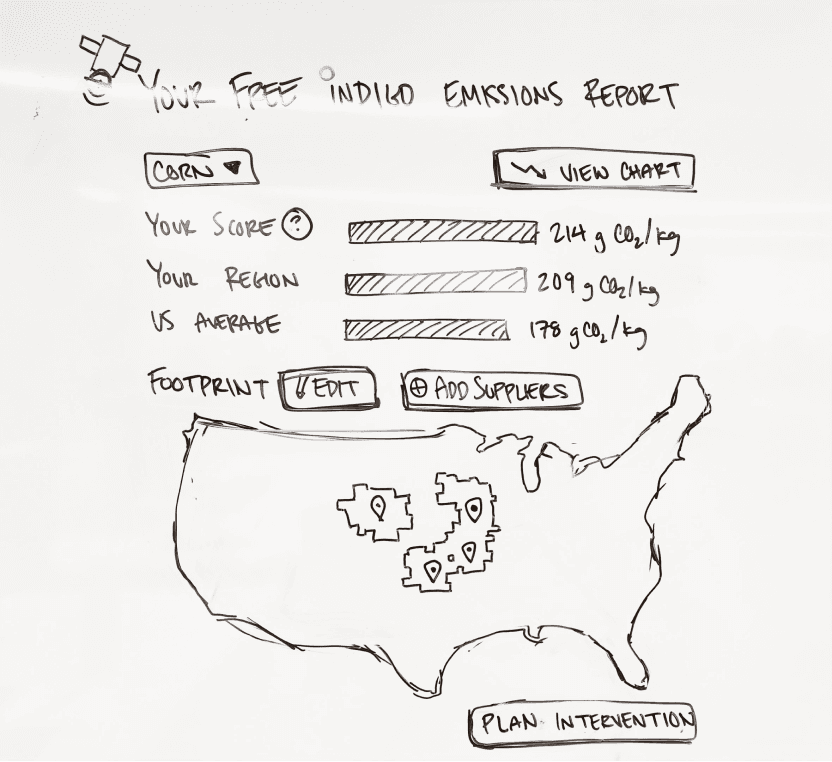
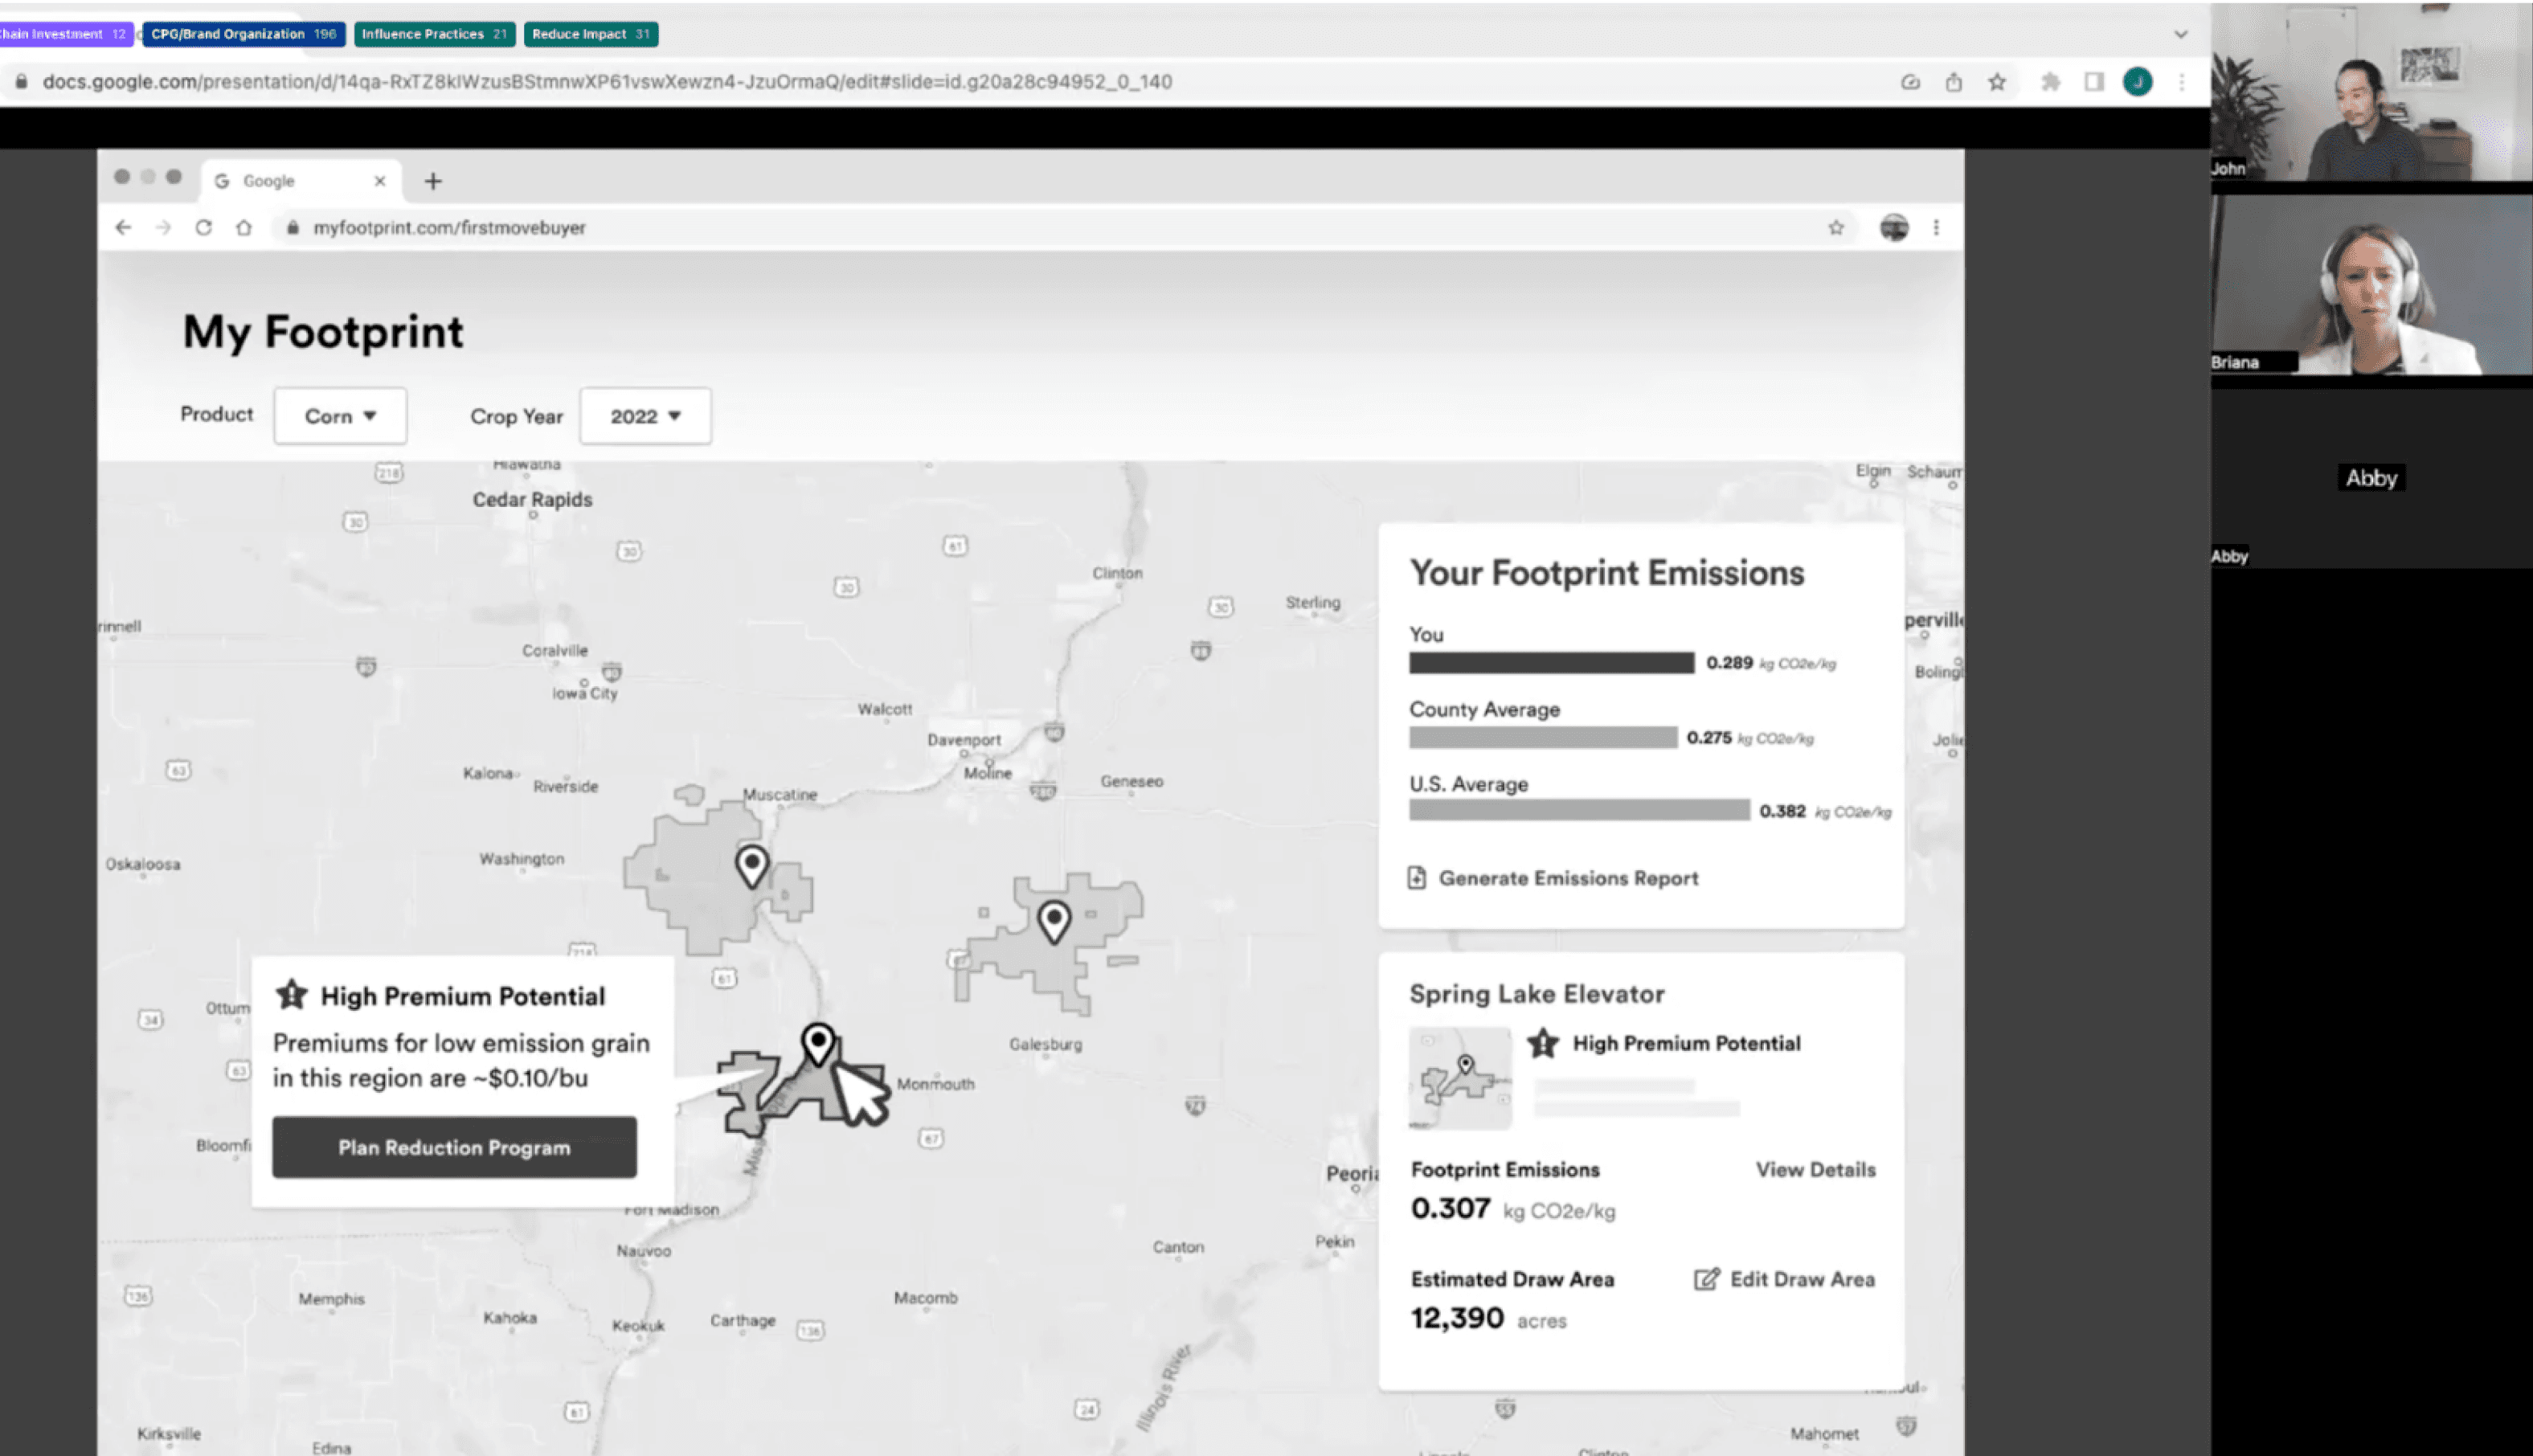
I refined the concepts into a lo-fi leading bet of a solution optimized for defining a supply chain, and then using a map to evaluate and explore emissions data associated with geographic areas.
Validation & Learnings
Concept in-hand, I went back to the same group of users/SMEs for feedback. There were a lot of key learnings but the most pivotal was that while a map made a lot of sense for users who were close to the farm (like a local grain buyer), they did not fit the mental model for the large food companies.
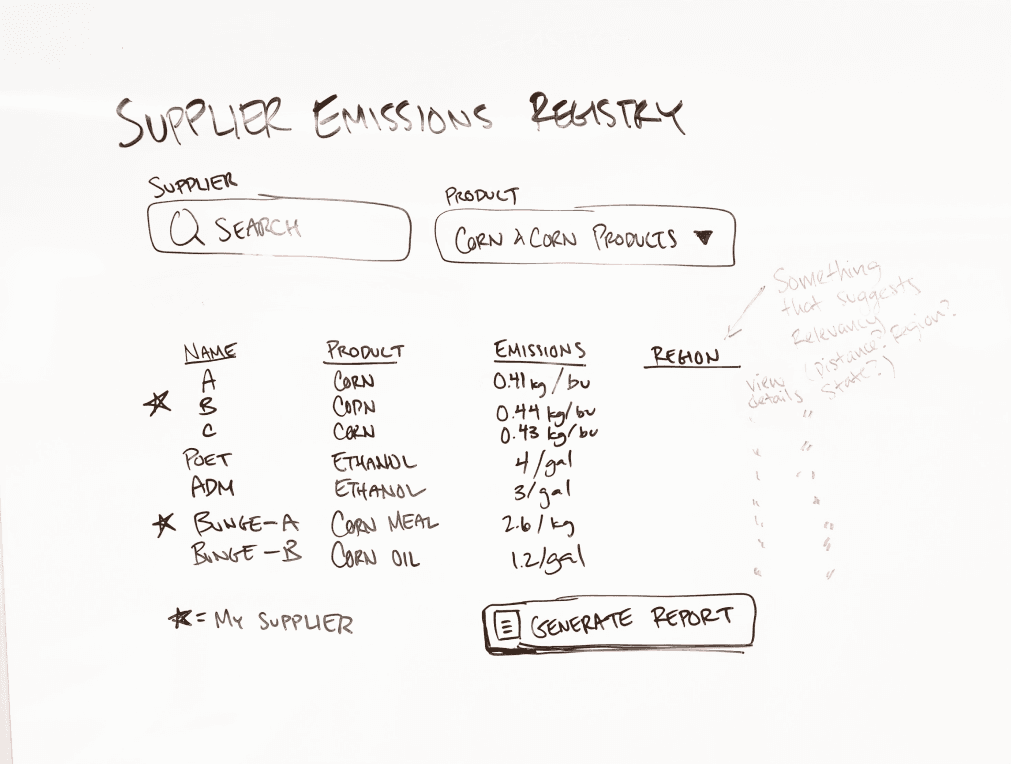
Large food companies buy millions of units of finished ingredients (e.g. vegetable oil, corn meal, or feed) and pictured their supply chain as a “list of suppliers”, only loosely associated with geography.
The Pivot
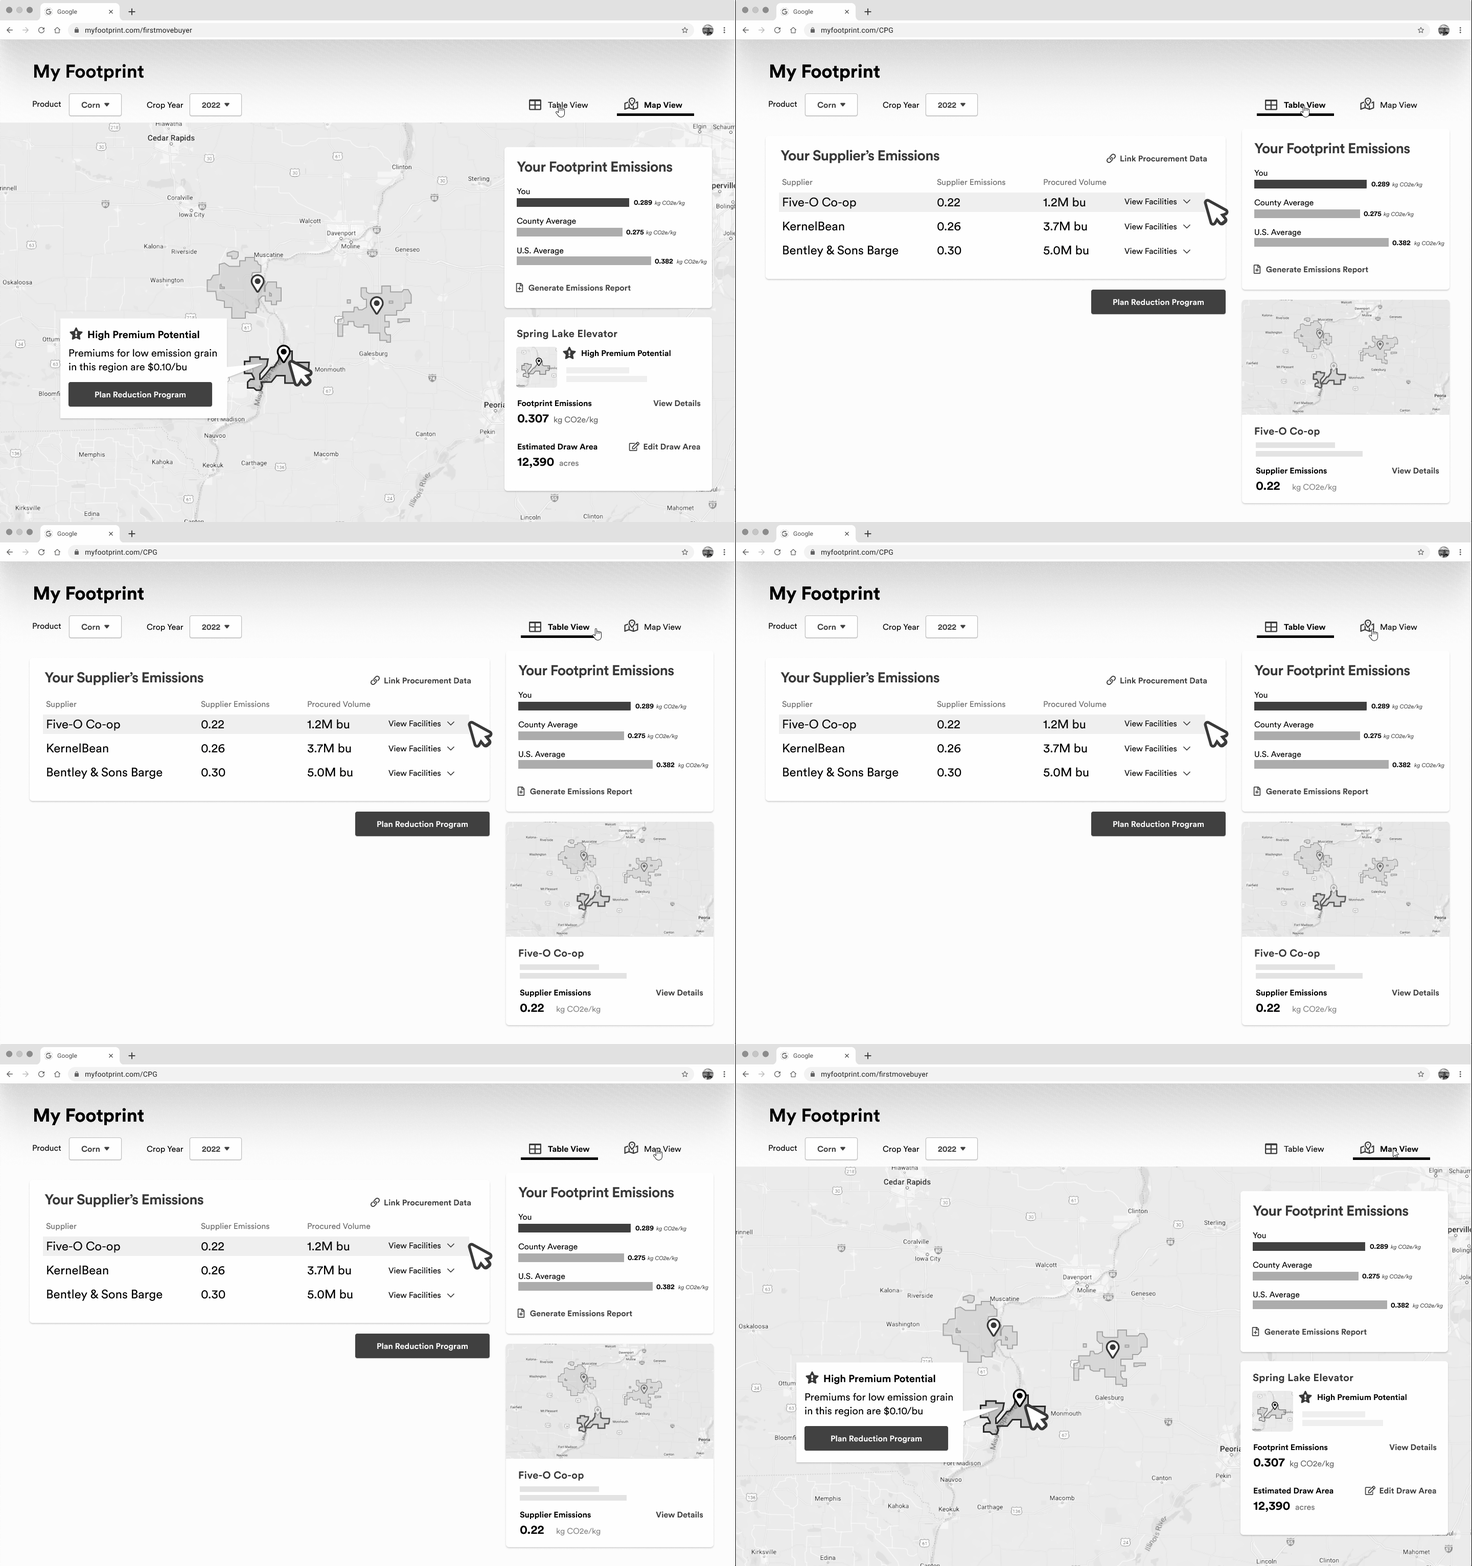
I adjusted the solution to handle two different viewing modes:
A geospatial, more visually delightful view for exploration
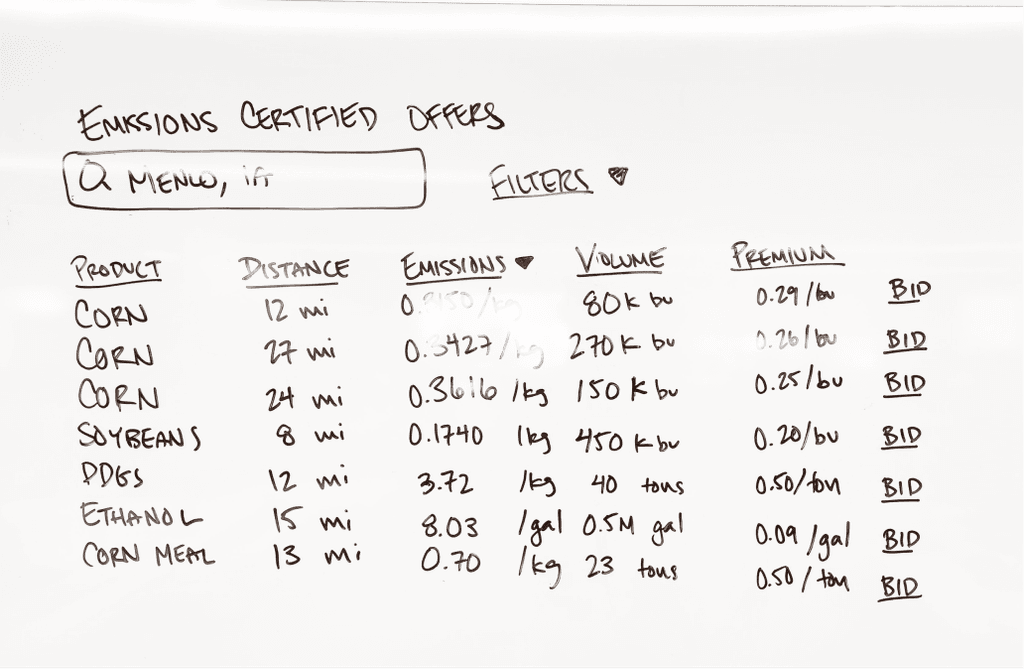
A tabular UX optimized for large data sets and handling lists of objects, facilities, or suppliers
This rapid round of feedback pivotally changed the approach but because I gathered feedback early the team was able to react and prioritize accordingly.
Solution
Implementation
With validated concepts in hand I collaborated closely with product and engineering partners, bringing the solutions to “just enough” fidelity to maintain velocity while still solving for the root problem. Many creative tradeoffs & decisions were made, and new discoveries were triaged with simplifying assumptions, and further rounds of feedback. As the project continued to gain momentum, I provided teachings & direction to other product, design, and tech leads to bring them up to speed on the problem space.
Ultimately we solved three key things:
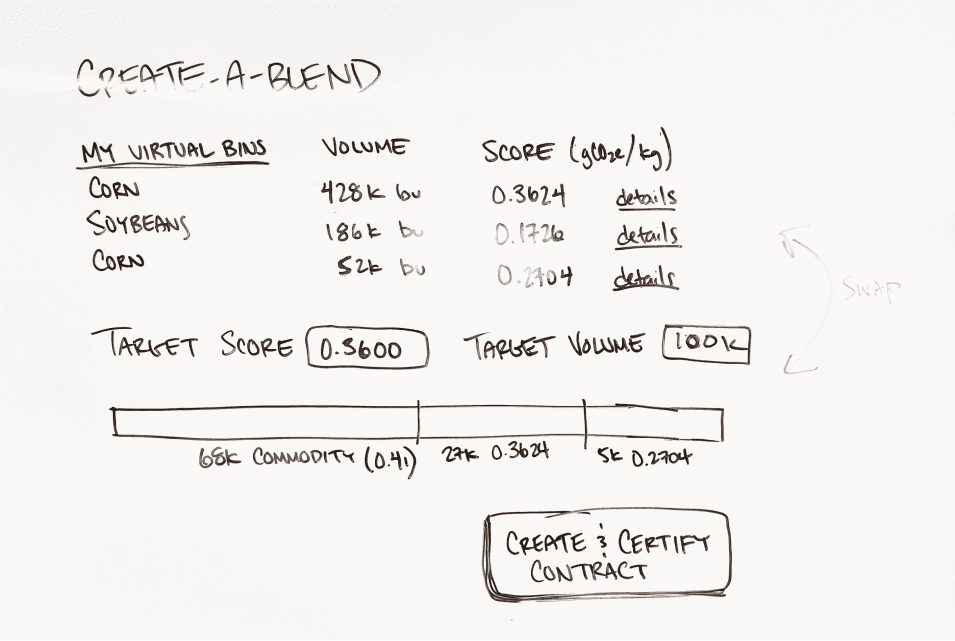
Provided a way to create and model supply chains
Provided measurable & claimable emissions data
Educated users on the science & methodologies
Results
Supported a case for 3.6x ARR growth from seven to eight-figures
Attained scalable six-figure revenue in only 3 months.
Onboarded the organization into the problem space, strategic vision, and leading solutions
Created all new mapping components & guidance, accelerating development for all geospatial use cases
Created inroads & partnerships with other key organizations at the company
